Instrumented Sensor Technology is proud to present:
DynaMax Suite makes a giant leap forward in field-data collection! This software is by far the most advanced, feature packed package of its kind in the industry. Not only are there more analysis tools then ever before, but the use of these tools couldn't be simpler!
DynaMax Suite comes with many standard features and includes all communications software.
DynaMax Suite System Requirements:
- Pentium 200 MHz computer (minimum, Pentium II recommended)
- 64 MB RAM (minimum, 128 MB recommended)
- Windows 95/98/NT/Me/2000/XP/Win7/Win8/Win10/ operating systems supported
- SVGA Monitor with 1024 x 768 resolution (minimum)
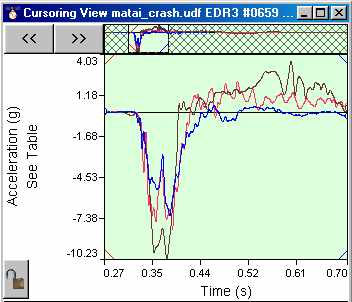
Crash test!
DynaMax Suite Cursor View with three impact waveforms from three different recorders, superimposed to show the transfer of energy from one vehicle to another.

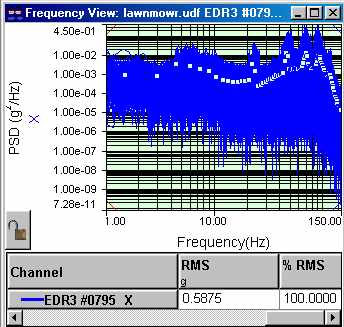
Vibration!
DynaMax Suite PSD view showing resonances in the structure of a riding lawnmower.

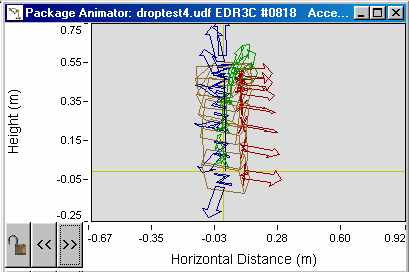
Drop Test!
DynaMax package animator shows the drop, orientation change of your package, and even computes the coefficient of restitution at the impact point.

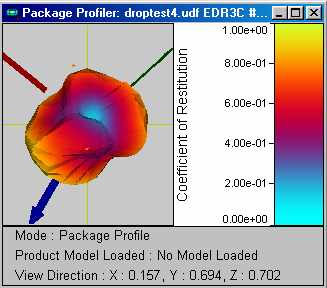
Package Profiler!
DynaMax can determine the performance of your packaging material. With just simple drops, a 3D rendering of energy absorbing capacity for the package can be computed.

DynaMax Suite Program Features and Options
DynaMax Suite, standard package (Catalog # DMW-BASE)
The base module of DynaMax Suite comes with every new recorder purchase. It features a generous software license agreement that lets you install it on any computers that you need to accomplish your mission. It is feature-filled with many advanced analysis tools that make it easy to handle large sets of data. DynaMax Suite is a 32-bit application program designed for Windows 95-XP based computers. (DynaMax has been tested and found to work well with all Windows OS from 95 through Win10 including 64 bit systems with the exception of early versions of Win 2000 64 bit systems.)
The base module also includes all communications packages such as EDR3COM, EDR3CCOM, SSCOM, and SSPCOM, along with converters for managing your old data.
- New, Advanced communications support for all IST recorders. Includes quick-start setups, automated test setup capability, enhanced user interface for easy recorder setup. Currently not available for the EDR4 Panther.
- Graphical views for full waveforms, multiple axis viewing, single or multiple events, X,Y,Z, or resultant. Waveform overlays for multiple waveform comparison.
- Powerful data reduction tools such as event hiding/showing, "deep bury" functions.
- Scatter plot views with user specified axis designations
- Configurable tabular views with statistical summaries, sorting, and exporting functions. Features real-time date stamps, peak acceleration, max, min, rms, crest factor, velocity change, and others.
- Export functions for exporting time-history data, tabular data, graphical data.
- Full compliment of digital processing tools such as Butterworth, Chebyshev, high-pass, low-pass, band-pass filtering, linear trend removal, filter magnitude & phase responses, user-defined filter characteristics.
- Multiple data set association for the graphical comparison of two different acceleration records. Useful for multiple location measurements or transmissibility measurements.
- Time-stamped environmental data such as temperature, humidity.
- Scripting/virtual recorder creation for custom user-defined functions & pre-analysis. Greatly assists in the automation of routine data analysis programs.
- Periodic software updates available through the IST web site
- Free telephone technical support.
DynaMax Suite, Integrator license (Catalog # DMW-INT)
The optional integrator license enhances the capability of DynaMax by graphically showing the integral and second-integral of an acceleration waveform. This enables you to calculate and view velocity and displacement based upon acceleration data. When DynaMax Suite is used in conjunction with other transducer types, such as rate transducers, this package enables for the calculation of 1st and second integral of the waveform data.
- 1st and 2nd integral waveform display in Cursor view & Multiwave view
- Tabular event data functions such as Peak V, rms, max, min, Delta-V
DynaMax Suite, Derivative license (Catalog # DMW-Deriv)
The optional derivative license lets you calculate the 1st derivative of an acceleration waveform. Commonly known as "Jerk" in crash data analysis.
- 1st derivative waveform display in Cursor view & Multiwave view
- Tabular event data functions such as Peak V, rms, max, min, Delta-V
DynaMax Suite, Power Spectral Density license (Catalog # DMW-PSD)
PSD calculations let you view your acceleration data in the frequency domain, as well as calculate profiles of the data set for exporting. Excellent module for transforming field-based data
- PSD Processing of vibration data via FFT, or DFT
- Zero-pad event window upon FFT
- All popular windowing functions: Hanning, Hamming, Rectangular, Blackman
- Event reduction tools, zoom functions, measurement cursors
- Multi-event averaging or maximum envelope calculations for export
- Export profile to CSV ASCII format
DynaMax Suite, Probability Density Function license (Catalog # DMW-PDF)
The PDF yields a good measure of the "normality" of a PSD profile. Data that is non-deterministic will show excellent correlation to a Gaussian bell curve. The PDF function yields either normalized or un-normalized PDF on single events or multiple events. Correlation is also computed.
- PDF function computation, on either a single event or multiple events
- Histogram format, with user-defined acceleration bin widths
- Gaussian curve overlay, with correlation computation
- Normalized or un-normalized PDF
DynaMax Suite, Transmissibility license (Catalog # DMW-trans)
Transmissibility is the measure of how a structure transmits energy. Used in conjunction with PSD analysis, this package enables you to evaluate suspension systems and other structures with regard to energy absorption and resonance.
- Compare any number of PSD profiles within a single channel set as a percentage of transmitted energy in the frequency domain
- Zoom functions & measurement cursors
- Multi-event averaging for export
- Export transmissibility curves to CSV ASCII format
DynaMax Suite, Shock Response license (Catalog # DMW-SRS)
Shock Response Spectrum (SRS) builds a user-defined array of single degree-of-freedom models and applies the field data to the model. The resulting model response to the field data helps point out critical frequencies that can be excited by the field data. Very helpful for assessing the damage potential of certain types of impacts on system designs.
- User-selectable drop height modes: Free-fall, impact, or max drop
- Graphical representation of fall, initial, and final orientation
- tabular data including calculated coefficient of restitution from impact, drop height, confidence interval, change in velocity, and more
DynaMax Suite, Package Profiler license (Catalog # DMW-pprof)
What are the energy absorption properties of your package? They can be very complex, depending on if the impact is on a top, side, bottom, edge, or corner. Package Profiler works in conjunction with the drop height analysis to actually measure the energy absorbing properties of the package. Once calculated, the 3D model of the package can be applied to the drop height analysis package for more accurate equivalent drop height calculations!
- 3D representation of the coefficient of restitution based on multiple drop data.
- Wire frame, or rasterized model
- User manipulation for easy 3D visualization
- Importable CAD models let you project the profile onto 3D shape of your product
- Profile available to drop height analysis package for more accurate drop height calculations
